

By R.L. Bynum
Carolina proved again to have the most dominant overall athletics program in the Atlantic Coast Conference and one of the best in the country.
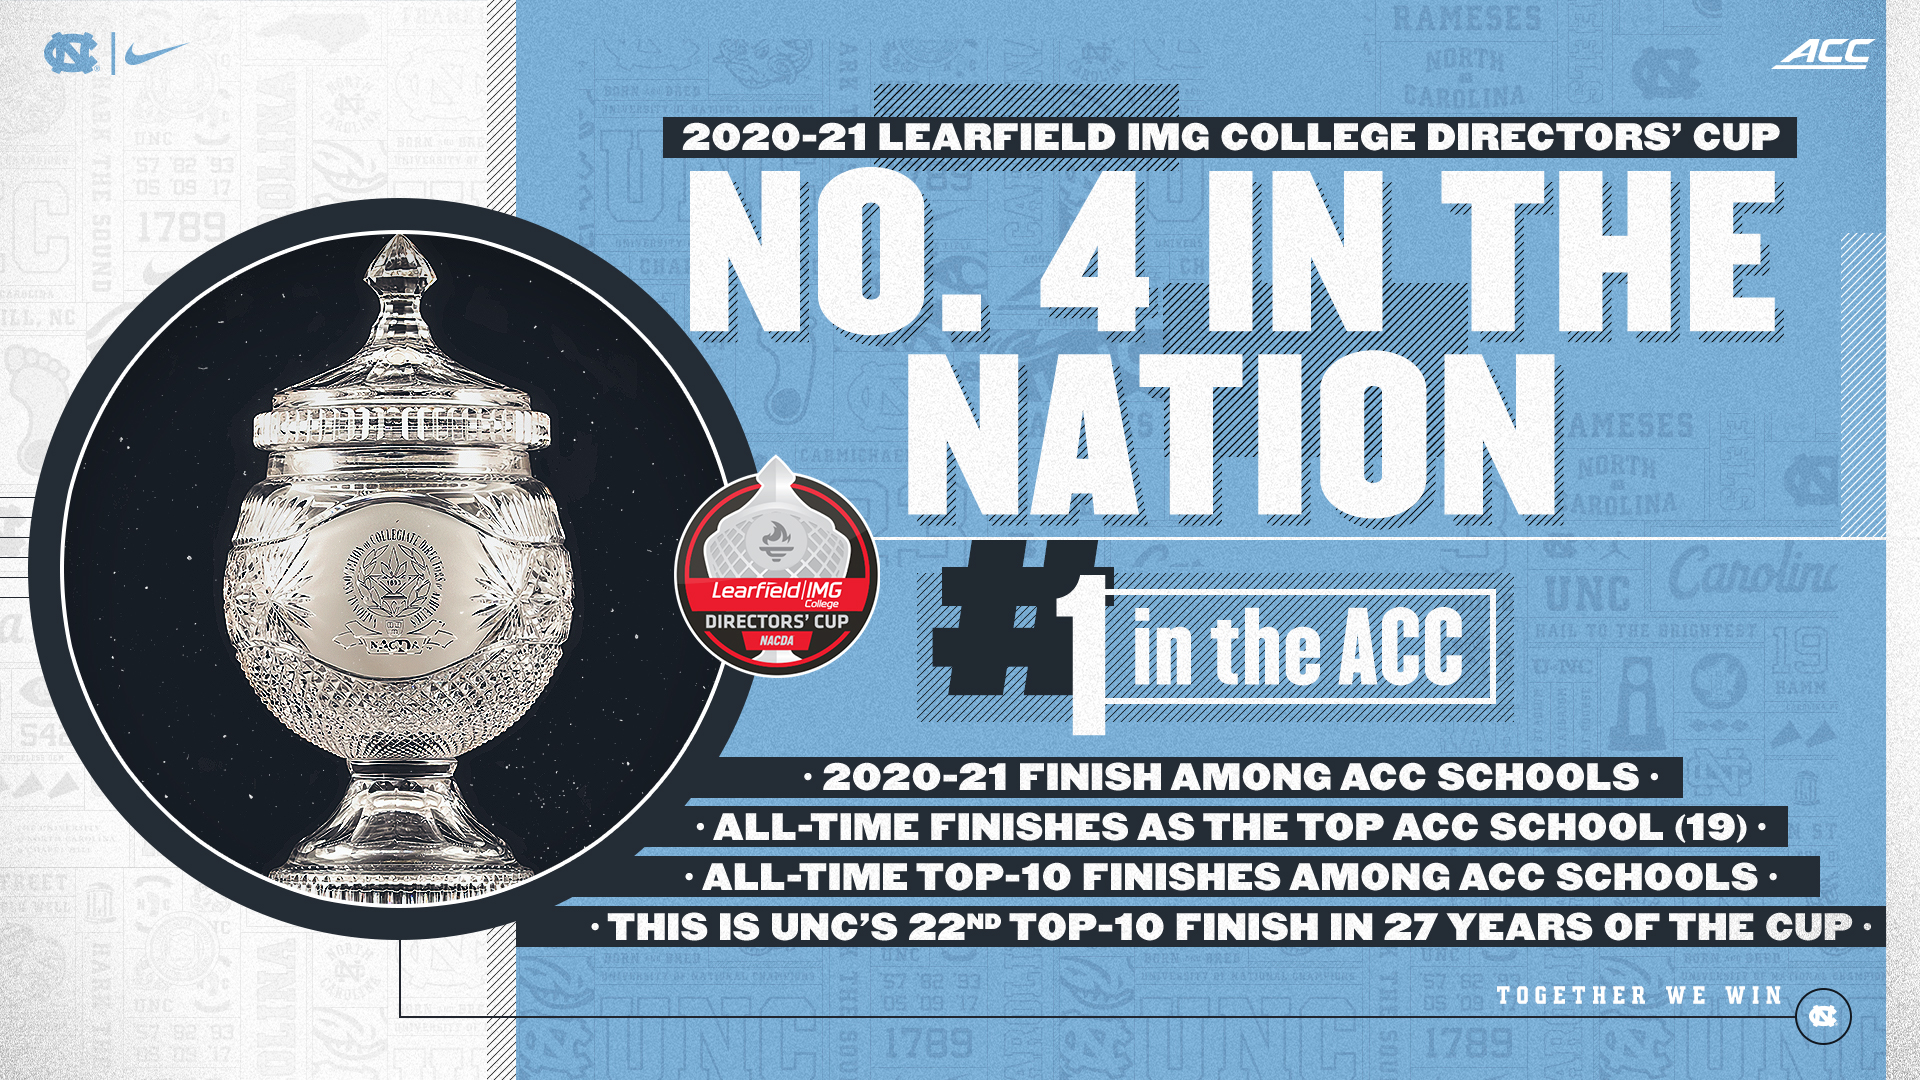
Sparked by a third consecutive field hockey national title and seven top-10 NCAA finishes, UNC finished fourth overall in the NCAA Directors’ Cup standings at 1,126.25 points, just behind Michigan’s total of 1,226.5. Texas finished first at 1,252 and Stanford was second at 1,126.2.
The fourth-place finish is Carolina’s best since 2009, when it finished second, and the 10th time in the top five.
Carolina easily outdistanced 11th-place Virginia (970.25) for the best ACC finish. The Tar Heels’ 22 top-10 finishes equal the total number of top-10 finishes by all other ACC schools combined. This is the 19th time UNC has topped the ACC in the Cup standings. The next highest is Duke and Florida State with three times each.
Years with the highest ACC finish
North Carolina: 1993–94, 1994–95, 1995–96, 1996–97, 1997–98, 1999–2000, 2000–01, 2001–02, 2002–03, 2003–04, 2005–06, 2006–07, 2007–08, 2008–09, 2012–13, 2014–15, 2015–16, 2016–17, 2020–21
Duke: 1998–99, 2004–05, 2010–11
Florida State: 2011–12, 2017–18, 2018–19
Notre Dame: 2013–14
Virginia: 2009–10
The Tar Heels’ average finish in the 27-year history of the Cup is seventh place. The next-best average in the ACC is Virginia at 15.5
Each school earns points in the standings based on NCAA postseason success in 19 sports, four of which must be baseball, men’s and women’s basketball and women’s volleyball. The field hockey title, for example, earned Carolina 100 points.
The five UNC teams — men’s and women’s lacrosse, men’s and women’s soccer and women’s tennis — that advanced to the NCAA semifinals with each earned 83 points. Men’s golf earned 72.75 by tying for fifth, fencing got 72 for a program-best sixth-place finish and men’s tennis served up 64 by finishing ninth.
NCAA Directors’ Cup standings
Place School Points
1 Texas 1,252
2 Stanford 1,195.75
3 Michigan 1,126.5
4 North Carolina 1,126.25
5 Florida 1,121.75
6 Southern California 1,052
7 Alabama 1,017.25
8 Arkansas 968.75
9 Ohio State 972.5
10 Georgia 971.5
ACC Directors’ Cup standings
Place School Points
4 North Carolina 1,126.25
11 Virginia 970.25
14 Notre Dame 900
16 Florida State 893
21 Duke 831.50
23 NC State 783.25
32 Virginia Tech 631.25
36 Clemson 554.75
40 Louisville 532.75
44 Georgia Tech 487
54 Wake Forest 394.75
62 Miami 358.5
64 Syracuse 328
73 Pittsburgh 279
UNC Directors’ Cup finishes
2020-21 4th
2018-19 10th
2017-18 13th
2016-17 5th
2015-16 7th
2014-15 5th
2013-14 14th
2012-13 8th
2011-12 8th
2010-11 6th
2009-10 7th
2008-09 2nd
2007-08 14th
2006-07 3rd
2005-06 4th
2004-05 9th
2003-04 7th
2002-03 8th
2001-02 4th
2000-01 15th
1999-2000 5th
1998-99 17th
1997-98 2nd
1996-97 2nd
1995-96 6th
1994-95 2nd
1993-94 1st
Photo courtesy of UNC Athletic Communications
