By R.L. Bynum
The eye test tells you that Carolina needs to play a lot better and the numbers back up that the Tar Heels’ performances haven’t been as good as last season.
Only one opponent has blown out Carolina’s men this season after Coach Hubert Davis’ first team dealt with several painfully one-sided losses. But the Tar Heels’ rank in many national statistical categories show plenty of significant drops from a year ago.
The Tar Heels’ worst loss this season was the 77–65 road setback at Indiana on Nov. 30. Six of their 10 losses last season came by larger margins — 98–68 against Kentucky in Las Vegas, 85–57 at Miami, 98–76 at Wake Forest, 87–67 vs. Duke, 89–72 vs. Tennessee in Uncasville, Conn., and 72–58 vs. Virginia Tech in ACC tournament.
With four starters back from last season’s Final Four team, UNC has avoided those demoralizing losses but hasn’t been able to finish out several games. The obvious difference from last season is that the Tar Heels don’t have Brady Manek’s perimeter shooting that spaced the floor and made it easier for his teammates. More on that later.
Injuries have been a factor. The only game a starter missed last season was when Leaky Black didn’t play against Purdue on Nov. 20. This season, Armando Bacot has missed one game and played less than two minutes in another with ankle injuries and Pete Nance has missed three with back issues.
Many have valid issues with how Davis uses his bench, but he hasn’t always had all of his reserves available. Puff Johnson missed six games with right knee issues and reserve D’Marco Dunn missed five games with a broken left hand.
Carolina’s record isn’t that much different through 23 games after losing to Duke than last season, at 15–8 compared to 16–7 a year ago. But you can quantify many statistical drop-offs in categories that the NCAA website shows for both seasons.
The big exception is turnover margin, where the Tar Heels have gone from No. 300 in the country last season (-2.0) to No. 156 (+0.5), a jump of 144 spots. They are the same or nearly the same in the only other major categories where the Tar Heels rank better nationally. They moved from:
— No. 196 in 3-point shooting percentage defense (33.7%) to No. 190 (33.8%), an increase of six spots.
— No. 237 in scoring defense (71.3) to No. 225 (71.3), +12.
The categories where the Tar Heels’ ranking has taken significant drops are eye-popping. They’ve fallen nationally from:
— No. 62 last season in 3-point-shooting percentage (35.8%) to No. 317 this season (30.8%), a drop of 255 spots
— No. 24 in free-throw percentage (76.4%) to No. 107 (73.4%), -83.
— No. 46 in assists-to-turnovers ratio (1.28) to No. 110 (1.14), -64.
— No. 133 in field-goal percentage (44.7%) to No. 193 (44.3%), -60.
— No. 3 in rebounding margin (+8.5) to No. 45 (+4.7), -42.
— No. 136 in field-goal percentage defense (42.5%) to 178 (43.5%), -42.
— No. 72 in scoring margin (+6.6) to No. 104 (+6.3), -32.
— No. 32 in scoring offense last season (77.9) to No. 46 this season (77.6), -14.
The two that stand out are the drop in rebounding margin, a longtime strength of the Carolina program, and assists-to-turnovers ratio for a veteran backcourt.
The Tar Heels, who lead the ACC in defensive rebounding, have an average rebounding edge of 7.2 in the 15 wins and it’s even in the eight losses. According to KenPom.com, UNC’s offensive rebounding percentage of 30% is 139th in the country.

The poor 3-point shooting is a program trend that the Heels escaped last season, partially thanks to Manek. The worst 3-point shooting percentages in program history have happened in the last four seasons — 30.4% in 2019–20, 31.8 in 2020–21 and 30.8% so far this season.
Carolina has shot less than 30% from 3-point range 11 times this season — including three of the last four games (22.2% against N.C. State, 18.5% against Pittsburgh and 25.9% against Duke) — after having only 10 such games all of last season.
UNC is shooting 33.6% from 3-point range in the wins and 25.6% in the losses.
The big factor in Carolina’s 35.8% 3-point shooting last season was Manek. He shot 40.3% from outside the arc, while the rest of the team shot 34.1%. That’s still a lot better than this season’s team’s 30.8%.
Nance — Manek’s replacement in the starting lineup — is shooting 31.9%, a drop-off from 36.4% as a junior and 45.2% as a senior at Northwestern. He’s attempting more 3s this season, an average of 3.6 per game after averging 3.1 last season and 2.7 two seasons ago.
According to KenPom.com, Carolina is 32nd in the country in offensive efficiencey (114.2), 44th in defensive efficiency (97.8), 214th in effective field goal percentage (49.9) and 14th in turnover percentage (15.3),
Ultimately, wins is the only statistic that counts and Carolina needs as many as possible in its last eight regular-season games to give the Tar Heels a chance at making another long NCAA tournament run.
UNC in national statistics
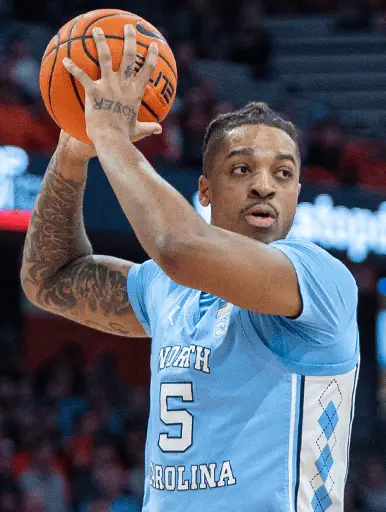
Photo via @UNC_Basketball


